Australia built 4,990 more homes. NSW added 6,820.
June 2026 quarter · Published 7 October 2026 · By David Warburton
4,990 more completed homes in 2025–26.
Financial year ending June 2026 · All states and territories · Original annual counts
Australia completed 180,500 homes in 2025–26, an increase of 4,990 on the previous year. NSW alone finished 6,820 more. Falls elsewhere, especially Western Australia, pulled the national increase back.
Four states and territories moved ahead; four went backwards. And even with more homes completed overall, fewer new houses were finished. We’ve gone through the numbers to see where the improvement came from, how it compares with the past 20 years, and what it means when you’re looking for a place of your own.
A useful increase, spread unevenly
The annual total rose 2.8%, from a revised 175,510 to 180,500. Victoria still completed the most homes, followed by NSW and Queensland. Together, those three states delivered almost 78% of Australia’s completions. Victoria remained the biggest builder, while NSW supplied most of the growth.
Four up, four down
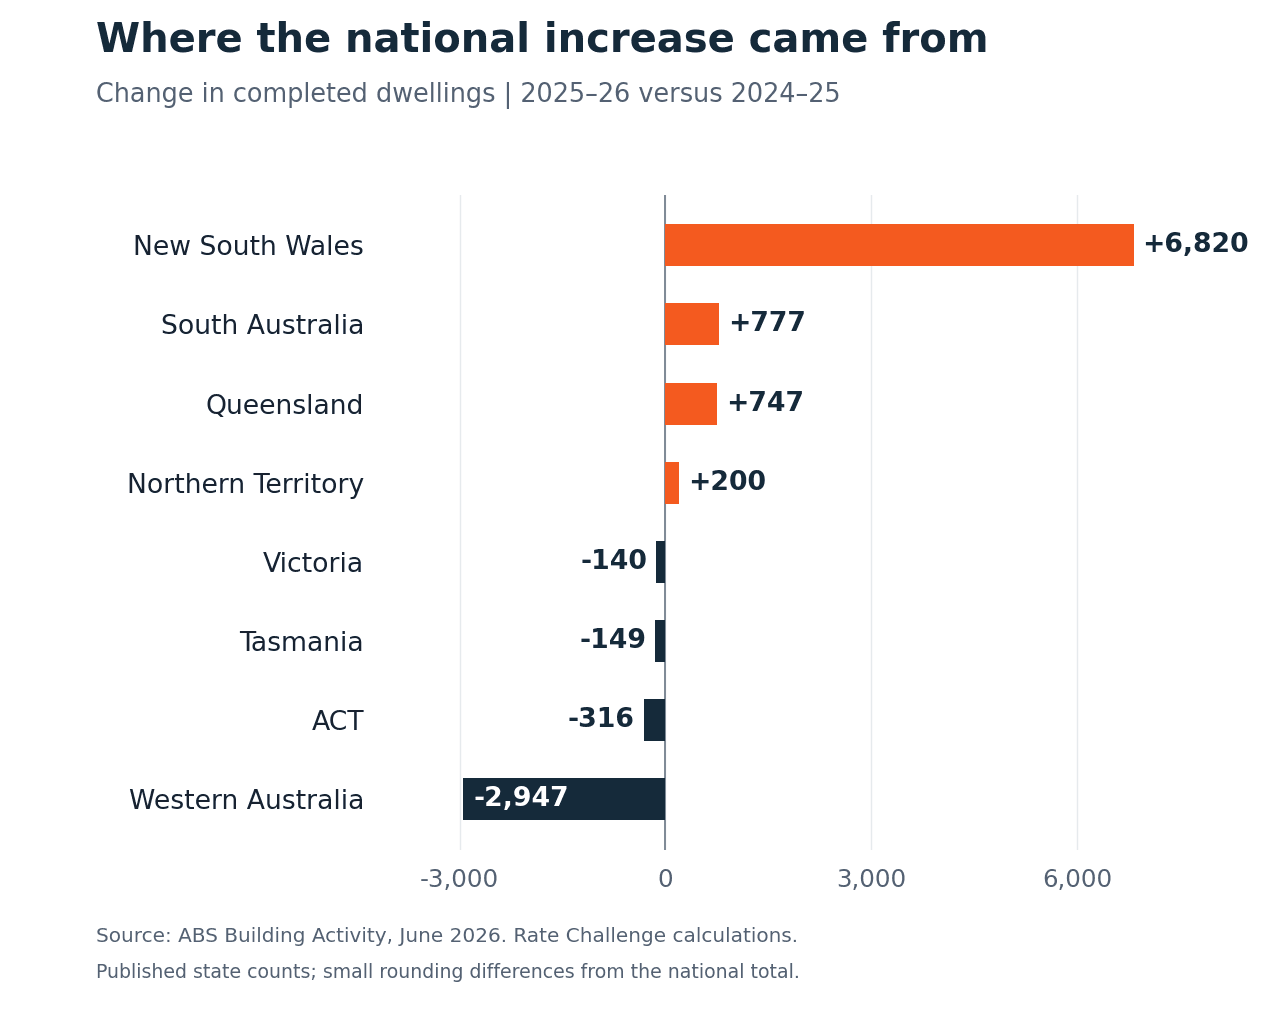
NSW supplied the largest increase: 6,820 extra completions, up 16.0%. Queensland added 747 and South Australia added 777. South Australia’s 13,647 completions were its strongest result in the 21 financial years shown, and 25.4% above its preceding 20-year average.
Western Australia had the largest fall, completing 2,947 fewer homes, although its annual total remained 3.2% above its preceding ten-year average. Victoria was nearly flat, down 140, while Tasmania and the ACT also declined.
The Northern Territory had the fastest percentage growth, up 38.4% to 721 completions—an extra 200 homes. Tasmania finished 2,349 homes, down 6.0%, and the ACT completed 3,800, down 7.7%. Those smaller markets moved in quite different directions too.
Where the national increase came from
Change in completed dwellings · 2025–26 versus 2024–25
Orange means more completed homes; navy means fewer. Open the chart at full size.
Compare all eight states and territories
| State or territory | 2024–25 | 2025–26 | Change | Change % |
|---|---|---|---|---|
| New South Wales | 42,725 | 49,545 | +6,820 | +16.0% |
| Victoria | 56,383 | 56,243 | −140 | −0.2% |
| Queensland | 33,880 | 34,627 | +747 | +2.2% |
| South Australia | 12,870 | 13,647 | +777 | +6.0% |
| Western Australia | 22,516 | 19,569 | −2,947 | −13.1% |
| Tasmania | 2,498 | 2,349 | −149 | −6.0% |
| Northern Territory | 521 | 721 | +200 | +38.4% |
| Australian Capital Territory | 4,116 | 3,800 | −316 | −7.7% |
| Australia | 175,510 | 180,500 | +4,990 | +2.8% |
The recovery looks different if you want a house
Nationally, new house completions fell 4.1% to 108,956. New “other residential” completions rose 16.6% to 70,923. This category includes apartments, townhouses, flats and similar homes.
NSW explains most of that increase. Its other residential completions rose from 19,453 to 28,293, adding 8,840 homes. At the same time, its new house completions fell by 1,724. NSW accounted for about 88% of the national rise in other residential completions.
So the improvement was concentrated in one state and one broad building category. New house completions went backwards nationally. South Australia also grew through other residential completions, while Western Australia recorded falls in both main categories.
New houses fell. Other residential buildings rose.
National completions · 2025–26 versus 2024–25
The national housing mix
| Dwelling type | 2024–25 | 2025–26 | Change |
|---|---|---|---|
| New houses | 113,650 | 108,956 | −4.1% |
| New other residential | 60,826 | 70,923 | +16.6% |
How does this compare with the building boom?
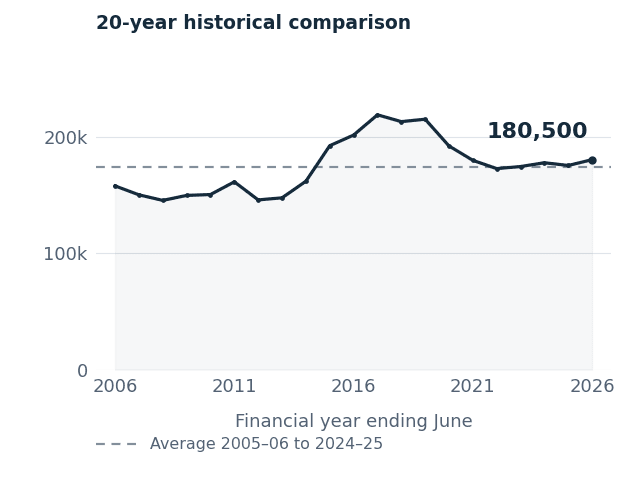
The 180,500 completions put Australia 3.6% above its preceding 20-year average of 174,280. So this was not an unusually low result across the whole period. It was, however, 6.1% below the preceding ten-year average and 17.6% below the 2016–17 peak of 219,052.
A big part of that gap is in apartments, townhouses and other residential buildings. Completions in that category fell from 103,731 in 2016–17 to 70,923 this year—a drop of 32,808, compared with 38,552 fewer completions overall. Australia has improved on last year, but the apartment-led boom that lifted the earlier peak remains a long way off.
Better than the long-run average. Below the building boom.
Dwelling completions · 2005–06 to 2025–26
The national result in context
| Comparison | Completed homes | 2025–26 versus comparison |
|---|---|---|
| 2025–26 | 180,500 | — |
| Previous year | 175,510 | +2.8% |
| 20-year average | 174,280 | +3.6% |
| 10-year average | 192,214 | −6.1% |
| Peak (2016-17) | 219,052 | −17.6% |
Optional: each state against its own 20-year average
| State or territory | 20-year average | 2025–26 | Versus average |
|---|---|---|---|
| New South Wales | 44,103 | 49,545 | +12.3% |
| Victoria | 54,242 | 56,243 | +3.7% |
| Queensland | 36,048 | 34,627 | −3.9% |
| South Australia | 10,884 | 13,647 | +25.4% |
| Western Australia | 21,096 | 19,569 | −7.2% |
| Tasmania | 2,718 | 2,349 | −13.6% |
| Northern Territory | 1,152 | 721 | −37.4% |
| Australian Capital Territory | 4,038 | 3,800 | −5.9% |
Why is it taking so long to build more?
First, projects have to stack up financially. Land, building costs, finance and the eventual sale price all matter. The RBA’s May 2024 assessment described pandemic disruption, construction bottlenecks and development costs that were high relative to expected returns. By June 2026, house construction costs were 51% above their pre-pandemic level in nominal terms, according to the Housing Council’s August report. It also warned that higher costs and interest rates could delay future construction. Rising property prices do not automatically make every proposed development viable, and the finance decisions being made now can affect supply years later.
Second, starting a project and finishing it are a long way apart. There were 248,733 dwellings under construction at the end of June. They are future homes in various stages of progress, not a ready-made addition to today’s listings. Large apartment projects can take years to deliver. Meanwhile, the Productivity Commission estimated that labour productivity in home building fell 12% between 1994–95 and 2022–23, even after adjusting for the size and quality of homes. Its July 2026 interim report also highlighted restrictive planning rules, slow approvals and poorly coordinated infrastructure. A site needs more than permission on paper: roads and services have to be available too.
Third, the obstacles vary. It is tempting to explain the whole result as a shortage of builders, but that misses the local differences. RBA liaison findings published in February 2026 reported improved contractor and labour availability for high-density construction in NSW and Victoria, with detached builders there able to take on more work. Elsewhere, labour conditions were tighter. Getting more homes finished involves several things working together: viable projects, suitable sites, approvals, infrastructure and people available at the right stage of the job.
Our take: more homes, but the recovery needs to spread
We welcome the increase. Another 4,990 completed homes is progress. What we would like to see next is that growth spread across more of the country and more types of housing. At the moment, NSW’s other residential buildings are doing much of the work behind the national improvement.
For buyers, that helps explain why better national numbers might not leave you with a longer shortlist. If you need a house in a particular suburb, an apartment completed in another city won’t give you another place to inspect on Saturday.
At Rate Challenge, we look at supply and affordability together. Are more suitable homes coming onto your market? What are comparable homes selling for? And what does that price mean for your deposit, repayments and the money left to live on? Those are the questions that bring a national housing report back to your own front door.
How we worked it out
Rate Challenge added the four original quarters in ABS Building Activity, June 2026, released 7 October 2026. Counts cover all ownership sectors. Annual changes compare 2025–26 with 2024–25; published national totals are retained despite small state-level rounding differences. Total completions include a small category beyond new houses and other residential.
The history contains 21 annual observations from 2005–06 to 2025–26. Twenty-year averages cover 2005–06 to 2024–25; ten-year averages cover 2015–16 to 2024–25. Both exclude the latest year. Percentages use unrounded values. Estimates may be revised. Completions measure output, not net housing-stock growth or housing need. The research explains possible constraints, without allocating the historical gap to individual causes or predicting prices.
- ABS: Building Activity, Australia, June 2026
- ABS Table 39: dwelling completions by sector, states and territories, original (XLSX)
- ABS Table 37: dwelling completions, Australia (XLSX)
- ABS Table 38: dwelling completions, states and territories (XLSX)
- ABS Building Activity methodology, June 2026
- RBA: Houses and Apartments in Australia · 15 June 2017
- RBA: Housing Market Cycles and Fundamentals · 16 May 2024
- Housing Council: Quarterly Report · 21 August 2026
- Productivity Commission: Housing construction productivity · February 2025
- Productivity Commission: Housing supply regulation, interim report · 27 July 2026
- RBA: Insights from Liaison · February 2026