Part 1: The Rising Cost of Getting into an Australian Home
Part 1 of our housing affordability history: how Australian home values, incomes, deposits and mortgage repayments changed, with charts and international comparisons.
Rate Challenge is an Australian mortgage broking business. For this series, we’ve brought together housing, income and lending data from the Australian Bureau of Statistics, Reserve Bank and Bank for International Settlements, alongside government archives, legislation and historical housing research. We’ve examined Australia, the UK, US, Canada and New Zealand, producing our own charts and calculations. The result is a ten-part history of Australian housing affordability, from the postwar shortage to the end of 2025. 139 127
What it took to buy in 2025
In 2025, the national average home value was about $1.04 million. A buyer putting down a 20 per cent deposit would have needed roughly $209,000, leaving a mortgage of about $835,000. Stamp duty, legal fees and other purchase costs would be additional.
The example uses the average value of houses and other dwellings in our Housing Affordability Explorer. Prices vary by property and location.
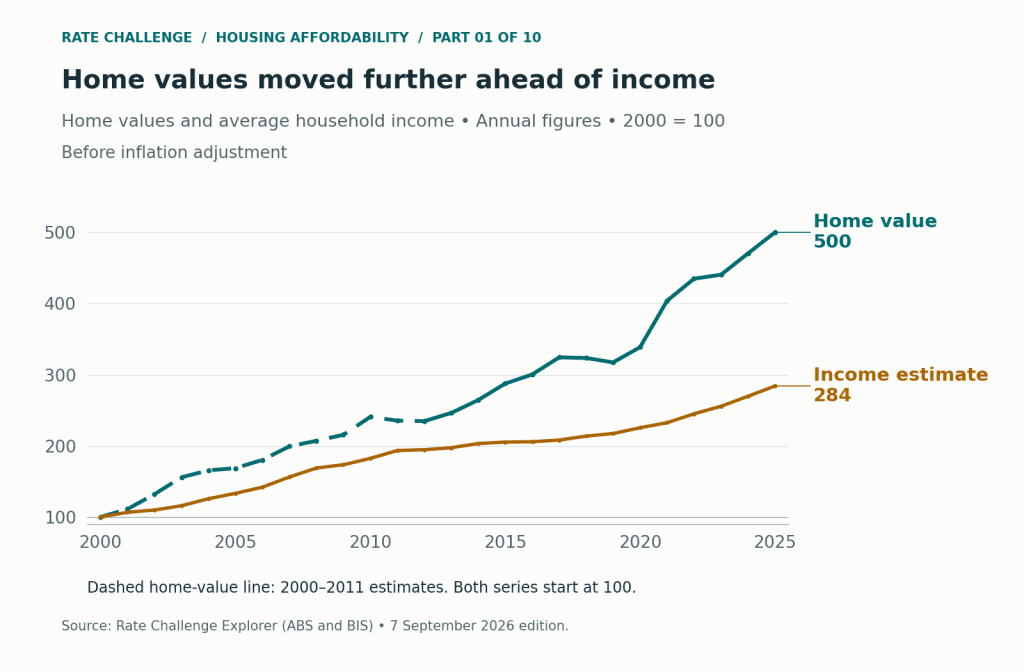
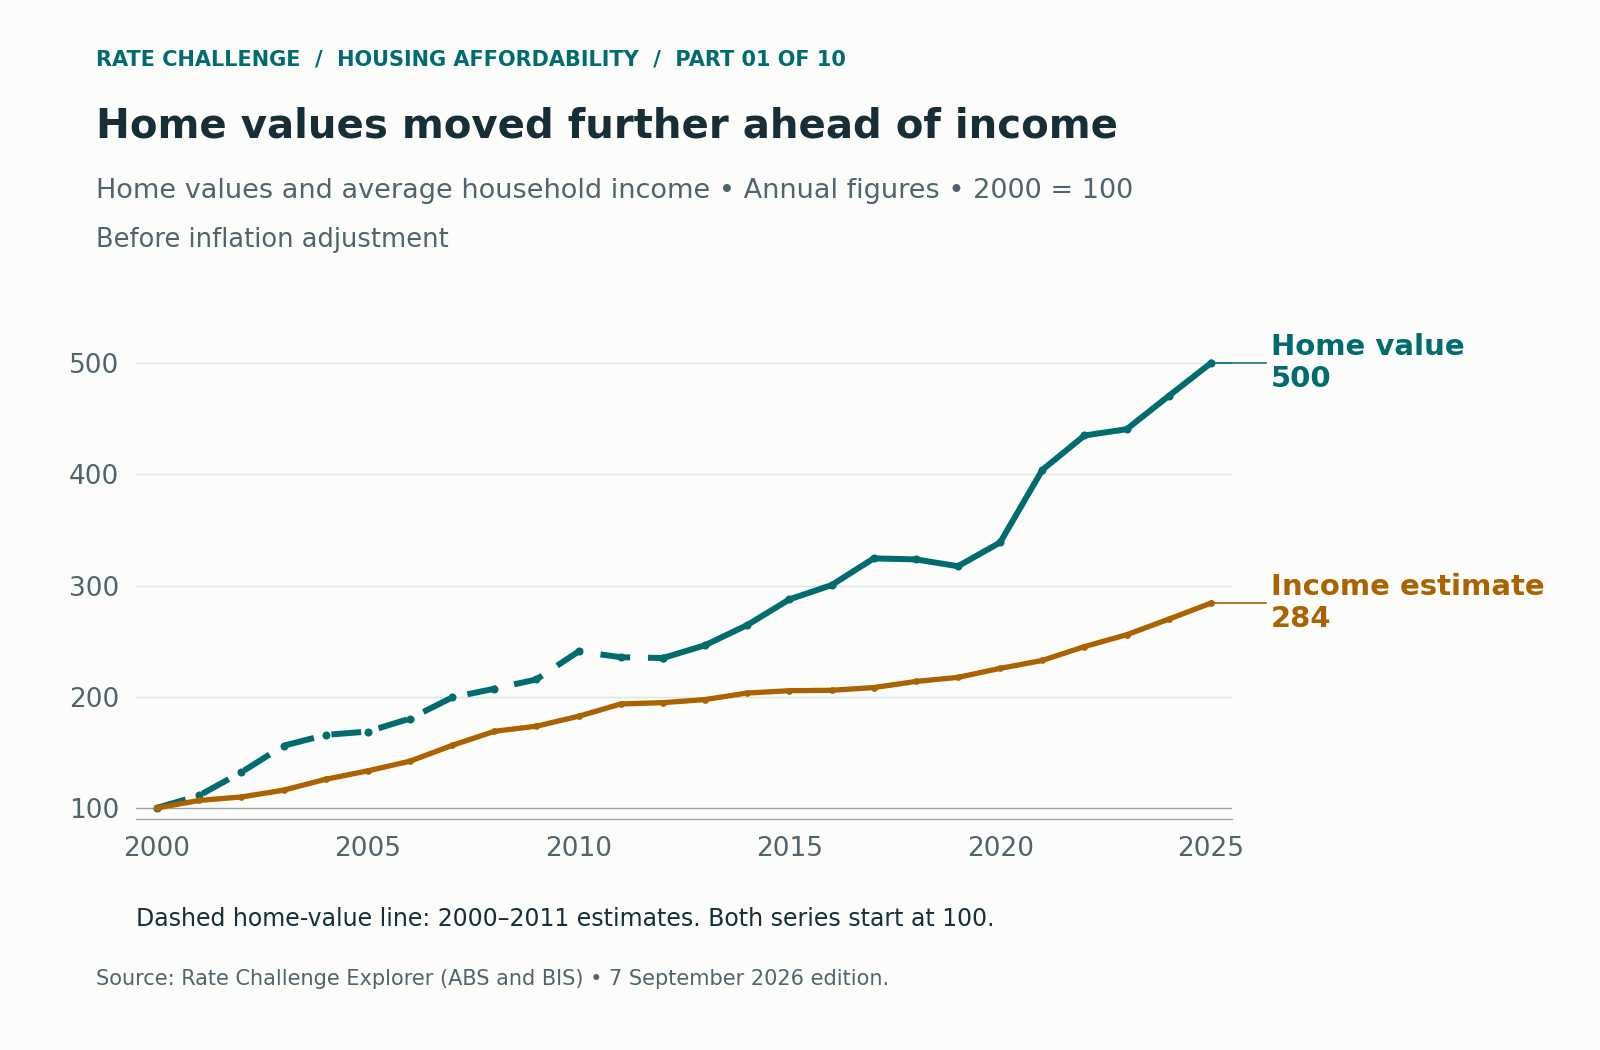
In the Explorer’s historical estimates, the home value represented about 3.3 times average annual household income in 2000. By 2025, that had risen to 5.8 times. Income had grown, but home values had grown much faster. 127
 View larger chart ↗
What the mortgage costs
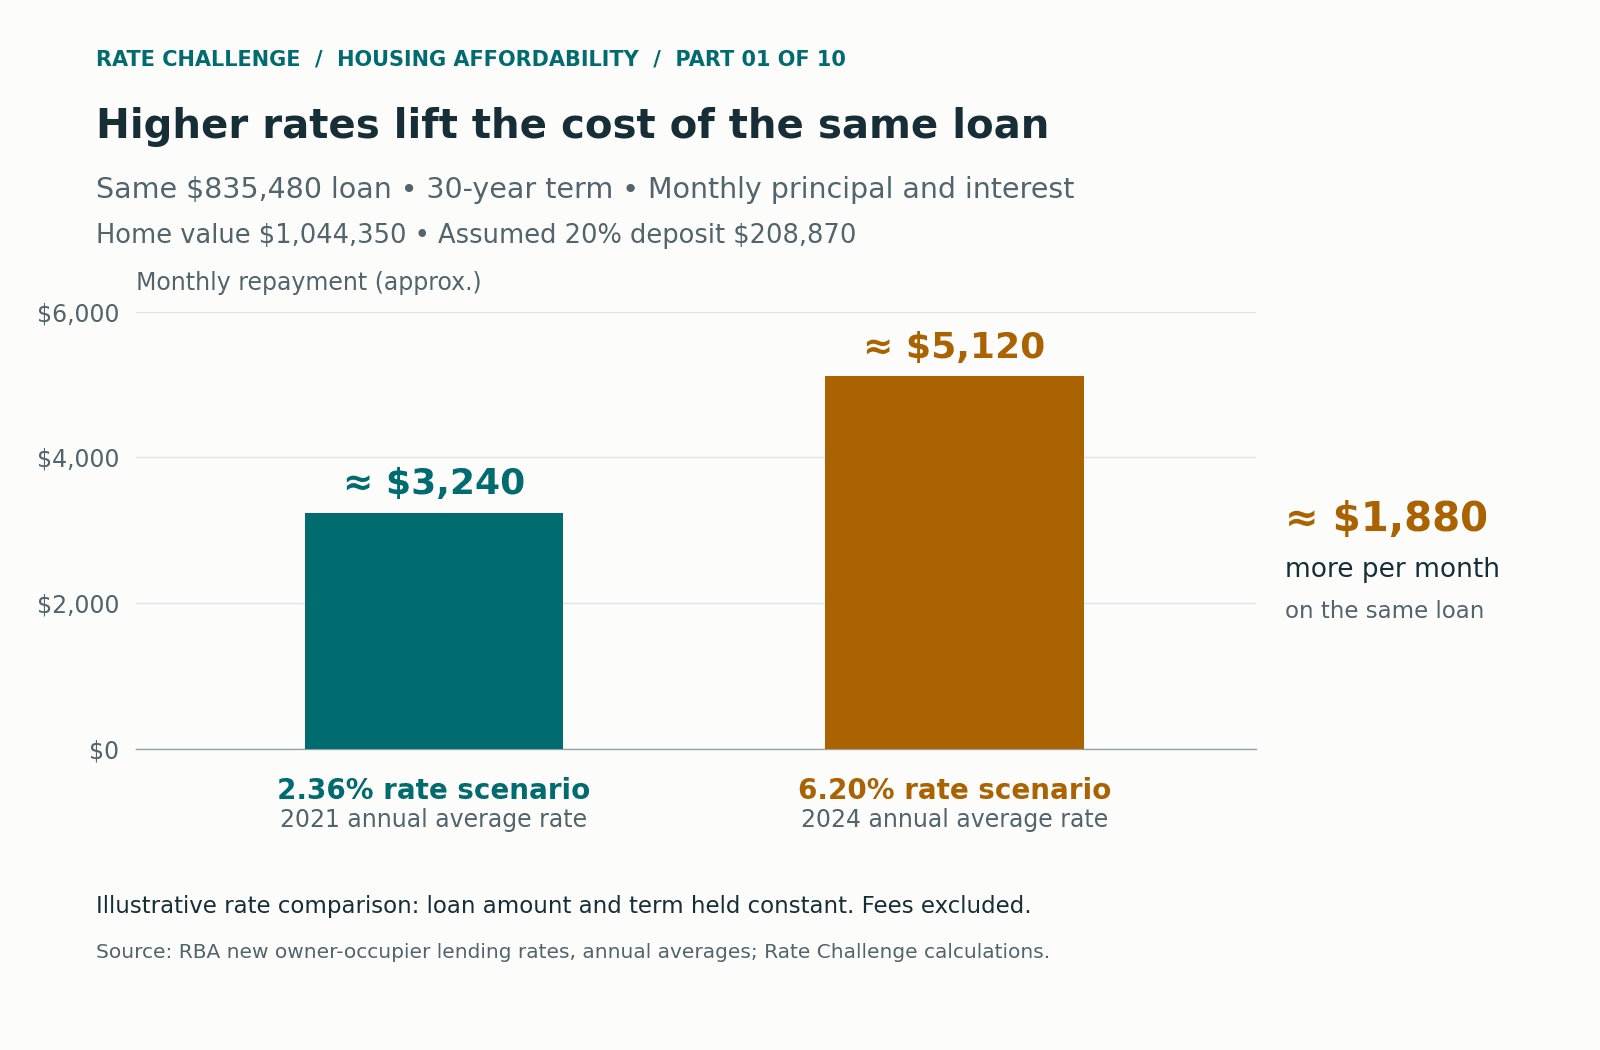
In 2021, the average rate on new owner-occupier principal-and-interest loans was 2.36 per cent. In 2024, it was 6.20 per cent, using rounded annual averages from Reserve Bank data. 72
On the mortgage in our example, repaid over 30 years, those rates produce monthly repayments of about $3,240 and $5,120 — a difference of roughly $1,880 a month. 72
 View larger chart ↗
Variable-rate borrowers can see their repayments rise as lenders change their rates. Those on fixed rates can face the adjustment when the fixed period ends. 20
Lower rates can ease those repayments. They can also give buyers more borrowing power, bringing more money into the housing market. 41
How the path into a home changed
In 1944, while the Second World War was still being fought, the Commonwealth Housing Commission estimated Australia’s housing shortage at about 300,000 homes. 1
The following year, Ben Chifley’s Labor government introduced the Commonwealth–State Housing Agreement, providing federal finance for the states to build rental housing. 1 2
In 1956, Robert Menzies’s Coalition government set aside part of the agreement’s funding for private home building through building societies and other approved institutions. 4 24
Home ownership spread through the postwar years. About 53 per cent of households owned their home in 1947, rising to 70 per cent in 1961, according to historical figures reported by the Australian Housing and Urban Research Institute. That broad expansion cannot be attributed to any one housing programme. 3
Decades later, changes to the financial system altered how much buyers could borrow. Deregulation widened access to loans in the 1980s. In the 1990s, falling inflation, lower interest rates and more competition between lenders made larger loans manageable on the same income. 6 41
That also meant more money competing for homes. The Reserve Bank identifies cheaper and more readily available finance as an important contributor to higher debt and prices, particularly where new housing failed to keep pace with demand. 41
Prices before and after inflation
Between the final quarters of 2000 and 2025, Australia’s property-price index rose about 398 per cent before inflation adjustment. After removing the general rise in consumer prices, the increase was about 152 per cent. 14
The adjustment changes the comparison with other countries, too. Australia had the largest rise before inflation among the five countries we examined. After inflation, New Zealand was ahead. 14
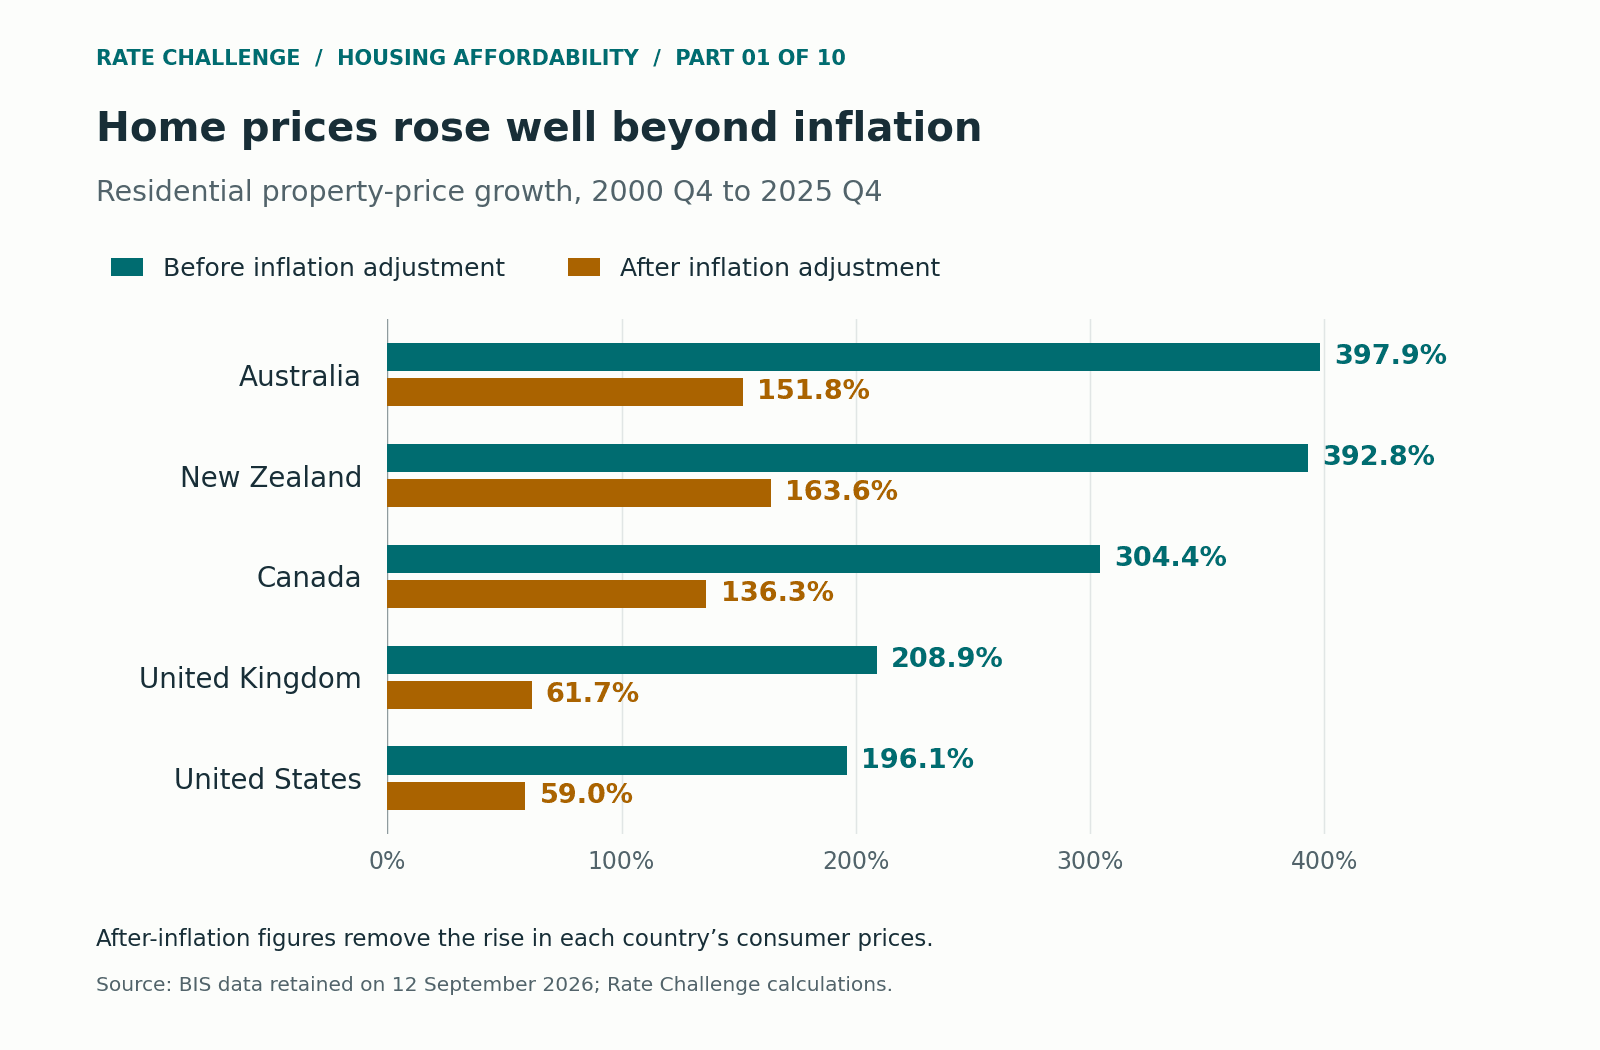 View larger chart ↗
| Country | Before inflation adjustment | After inflation adjustment |
|---|---|---|
| Australia | 397.9% | 151.8% |
| New Zealand | 392.8% | 163.6% |
| Canada | 304.4% | 136.3% |
| United Kingdom | 208.9% | 61.7% |
| United States | 196.1% | 59.0% |
BIS figures retained on 12 September 2026; 2000 Q4–2025 Q4 growth. Index coverage differs. Affordability also depends on incomes and mortgage costs. 14 15
Over the next nine chapters, we follow that history through the homes governments financed, the grants they offered and the lending rules they rewrote. It starts in 1945, with a country short of homes and a plan to get them built.
Data note: The 2000 home value is modelled, not a recorded national average. Income includes non-cash items; its 2025 average uses a projected household count. Explorer figures use annual averages; international figures use quarter ends. Methods and sources.
Research and calculations: Rate Challenge.
Sources for this article
- [139] Rate Challenge: About Rate Challenge — mortgage broking and home-loan research.
- [127] Rate Challenge; compilation of ABS, RBA, BIS and named historical sources: Australian Housing Affordability Explorer, 1980–2025.
- [72] Reserve Bank of Australia / source agencies: RBA Statistical Table F6: F6 – HOUSING LENDING RATES.
- [20] Reserve Bank of Australia: Fixed-rate Housing Loans: Monetary Policy Transmission and Financial Stability Risks.
- [41] Reserve Bank of Australia: Long-run Trends in Housing Price Growth.
- [1] Australian Institute of Health and Welfare: Housing assistance in Australia 2024: Housing policy framework.
- [2] National Museum of Australia: Ben Chifley: prime minister.
- [4] Government of Western Australia: Commonwealth and State Housing Agreement Act 1956, schedule clause 6.
- [24] National Museum of Australia: Robert Menzies: prime minister.
- [3] AHURI; Burke, Nygaard and Ralston: Australian home ownership: past reflections, future directions.
- [6] RBA; Edey and Gray: The Evolving Structure of the Australian Financial System.
- [14] Bank for International Settlements: Selected residential property prices, bulk data. Calculations use paired nominal and real indices retained on 12 September 2026, from 2000 Q4 to 2025 Q4.
- [15] Bank for International Settlements: Selected residential property prices: data documentation.
- [135] Australian Bureau of Statistics: Total Value of Dwellings, March quarter 2026, Table 1.