Skip to content
Rate Challenge Start Your Rate Challenge

Home loan rate option

Interest rate p.a.
Comparison rate p.a.*
Loan scenario
Feed checked

Conditions and lender availability

*Comparison rate information

Example & terms

Daily example: $600,000 · 80% LVR · Owner-occupied · Variable · P&I · Purchase

30-year loan. These are daily market examples, not a personal quote or a whole-market ranking. Changing the calculator does not change these rates.

Subject to lender criteria, fees and conditions. Rates can change. Some products may be outside our broker panel or available only directly.

Your request goes to Rate Challenge. We’ll confirm available options and suitability; requesting a rate is not an application or approval.

Feed checked 30 Sep 2026. This is the dataset check date, not a separate verification date for each product.

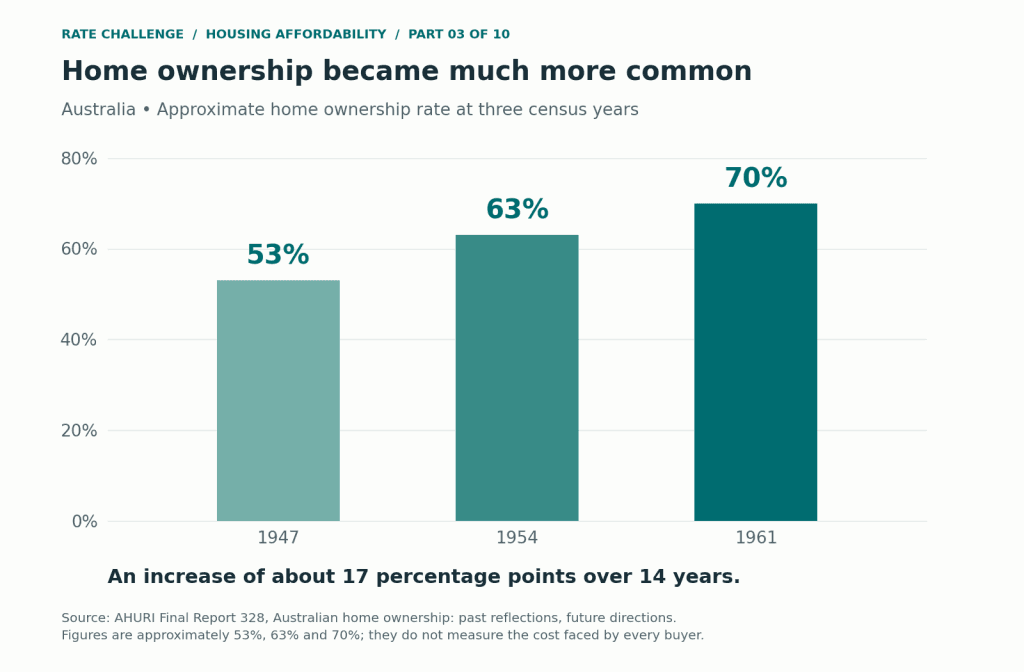
Australian home ownership was approximately 53% in 1947, 63% in 1954 and 70% in 1961. Home ownership includes households still paying for their home. Source: AHURI analysis of ABS census data.

Part 3: The 1950s — How Home Ownership Spread

Part 3 of our housing affordability history follows the spread of home ownership in the 1950s, the 1956 housing agreement and a lending system where a low rate did not guarantee a loan.

Scroll to Top