Part 3: The 1950s — How Home Ownership Spread
Part 3 of our housing affordability history follows the spread of home ownership in the 1950s, the 1956 housing agreement and a lending system where a low rate did not guarantee a loan.
Part 3 of Rate Challenge’s ten-part history of Australian housing affordability, following the prices, home loans and government decisions that shaped the market from 1945 to 2025.
Seven in ten households owned their home
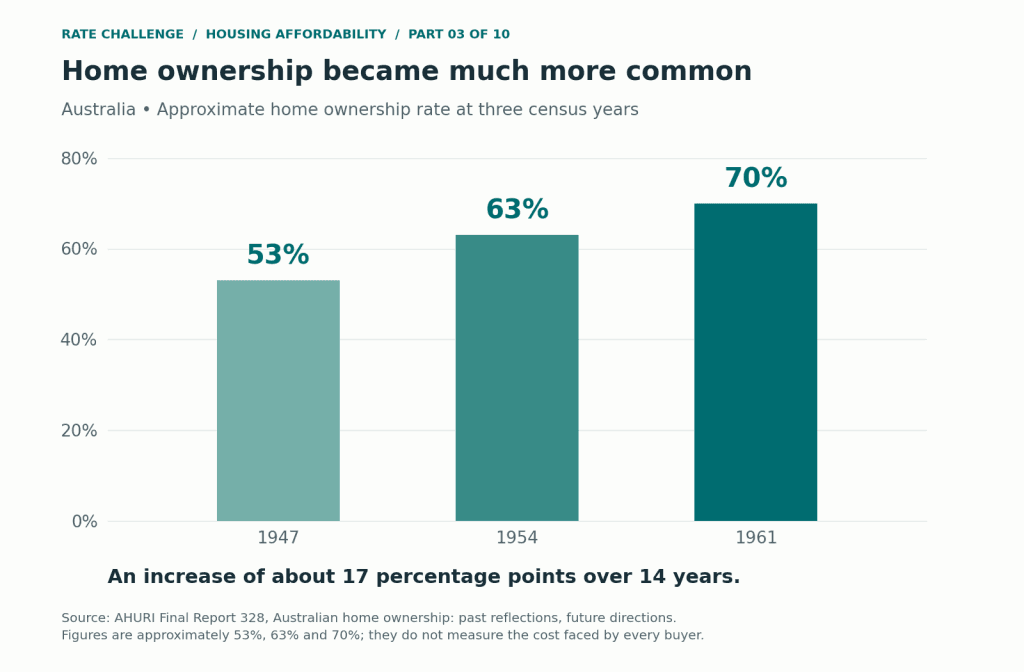
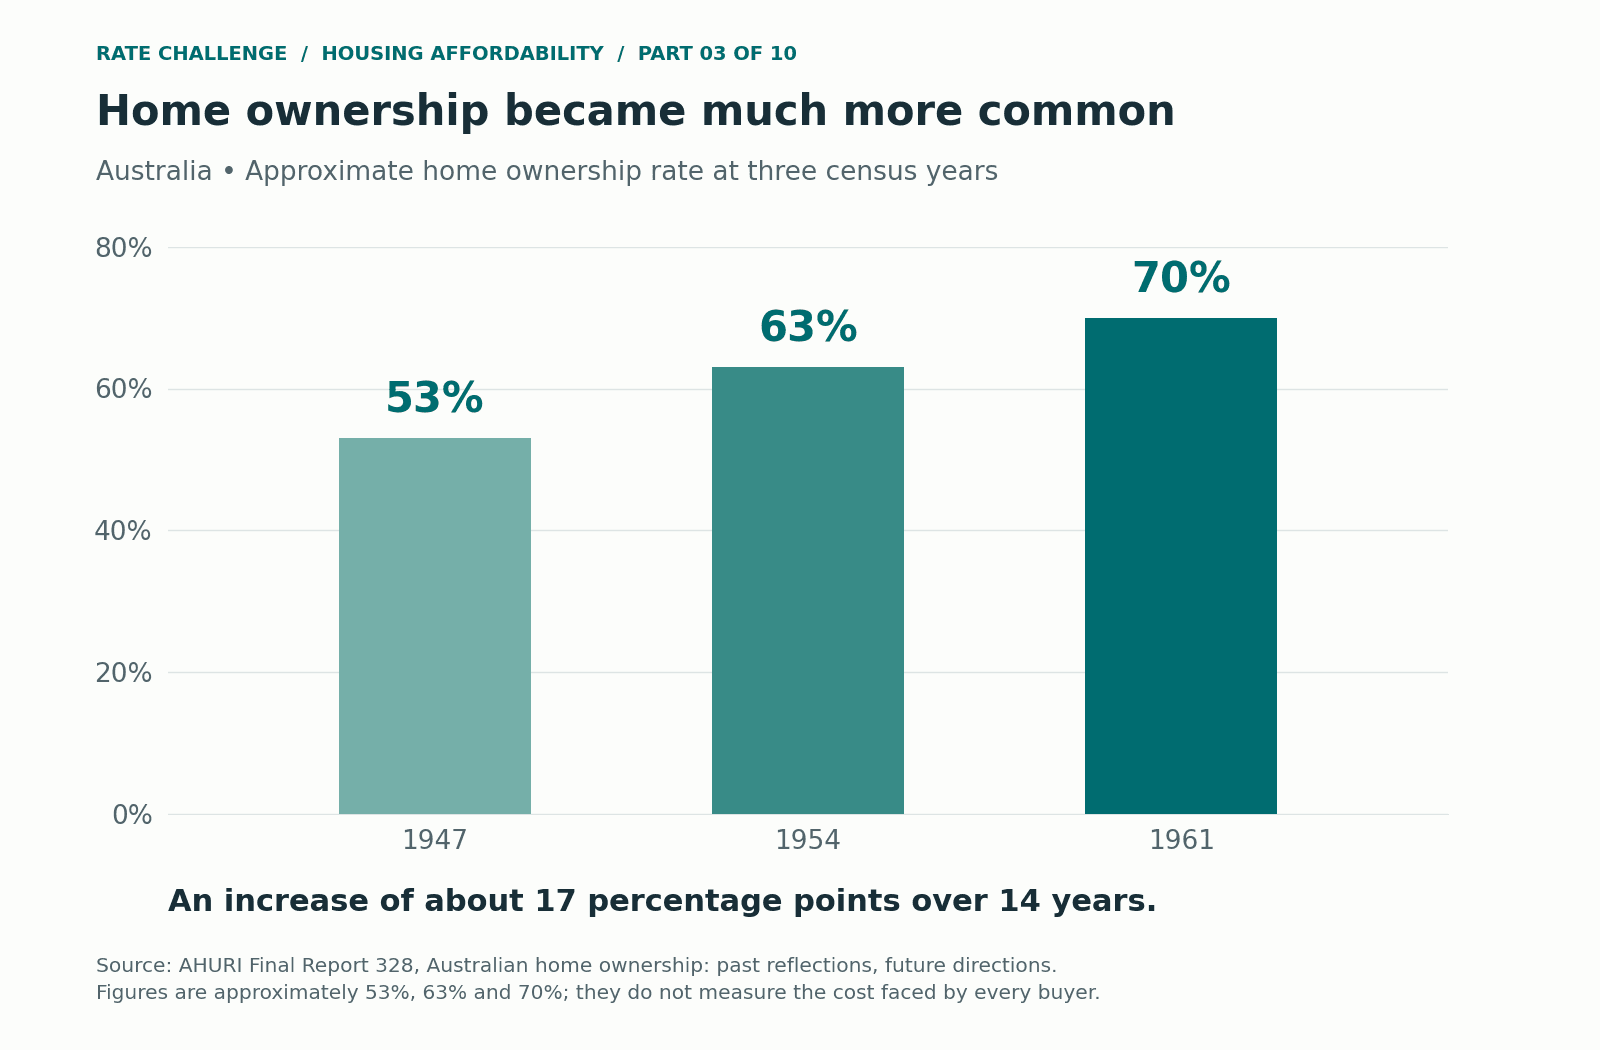
Australian home ownership rose from about 53% in 1947 to 70% in 1961. In fourteen years, owning a home became substantially more common, even as the country’s population grew.
The historical census figures, compiled by the Australian Housing and Urban Research Institute, put ownership at 63% in 1954. Much of the increase had already occurred before the Menzies government changed its housing agreement in 1956. 3
 View larger chart ↗
The figures also show where much of the increase occurred. The share of households still paying for their home rose from about 8% in 1947 to 23% in 1961. Borrowing was helping a growing number become owners. 3
This expansion took place in a closely regulated lending system. Banks’ interest rates were controlled, and the amount of credit available could be restricted. A buyer’s ability to obtain a loan depended partly on the funds a lender was allowed to advance. 6
The boom and reversal behind household budgets
The decade began with a surge in Australian export earnings. The Korean War drove up demand for wool, then one of the country’s major exports. Prices subsequently collapsed, reversing part of the economic stimulus. 124
The effect on living costs was dramatic. Consumer prices rose about 25% in the year to December 1951. By late 1954, annual inflation had fallen to around zero. 124
Robert Menzies led the Liberal–Country Party government throughout this period. Treasurer Arthur Fadden’s 1951–52 budget raised taxes sharply, reinforcing the slowdown as the export boom faded. 24 23
For households, the change reached beyond the price of a home. Higher food and other everyday costs could absorb money intended for savings. The subsequent slowdown brought a different concern: keeping the earnings needed to save and repay a loan. An eventual rise in ownership does not mean the path was smooth for each buyer.
Population growth also continued. Migration added about 1.2 million people between 1946 and 1960, accounting for more than a third of population growth over that period, according to the National Museum of Australia. The housing system was accommodating new arrivals as well as existing households. 22
Menzies redirects housing finance
In 1956, the government changed how Commonwealth housing advances were distributed.
The revised Commonwealth–State Housing Agreement required at least 20% of advances in 1956–57 and 1957–58 to support people building or buying their own homes through building societies and other approved institutions. From 1958–59, the minimum increased to 30%. 4
Public housing remained part of the arrangement, while a larger share of the federal finance supported private ownership. The percentages applied to ordinary advances under clause 5 of the agreement, not to all Australian housing expenditure. 4
For an eligible buyer, assistance could therefore arrive through the institution financing a home. The government did not need to give the buyer a cash grant to support the purchase.
A low interest rate did not guarantee a loan
The RBA’s advertised standard variable housing loan series begins at 5% in 1959, but access to finance remained restricted. 9 6
An RBA history of the financial system describes bank credit in the 1950s as rationed. Life insurance companies also provided mortgages, meeting some of the demand banks did not satisfy. Building societies would become increasingly important as the regulated banking system lost business to other institutions. 6
Canada was addressing access to finance through another route. In 1954, its national housing corporation introduced mortgage loan insurance, reducing lenders’ risk and helping buyers purchase with smaller down payments. 106
In Australia, direct help with a buyer’s savings would follow a decade later. In 1964, Menzies introduced a grant that added £1 for every £3 an eligible applicant had saved, up to £250. 5
The historical sources in this chapter extend the research behind our Housing Affordability Explorer to the decades before its 1980 starting point.
Sources for this article
- [3] AHURI; Burke, Nygaard and Ralston: Australian home ownership: past reflections, future directions.
- [6] RBA; Edey and Gray: The Evolving Structure of the Australian Financial System.
- [124] Reserve Bank of Australia; Glenn Stevens: Inflation and Disinflation in Australia: 1950–91.
- [24] National Museum of Australia: Robert Menzies: prime minister.
- [23] Reserve Bank of Australia; Ian Macfarlane: The Economics of Nostalgia.
- [22] National Museum of Australia: Postwar immigration drive.
- [4] Western Australian legislation, original 1956 agreement: Commonwealth and State Housing Agreement 1956.
- [9] Reserve Bank of Australia / source agencies: RBA Statistical Table F5: F5 INDICATOR LENDING RATES.
- [106] Canada Mortgage and Housing Corporation: CMHC’s Story.
- [5] Commonwealth Minister for Housing, L. H. E. Bury; PM Transcripts: Homes Savings Grant Bill 1964, second-reading speech.